


What Is a Coordinate Grid and How to Plot Points
What is a Coordinate Plane?
A coordinate plane is a two-dimensional surface made up of two number lines. It is formed when a horizontal line known as the X-axis and a vertical line known as the Y-axis intersect at the origin. Points are located using the numbers on a coordinate grid. A coordinate plane is useful for graphing points, lines, and other objects. It functions as a map, providing precise directions from one point to another.
Description of a Coordinate Plane
In this section, we will learn about the components of a coordinate plane.
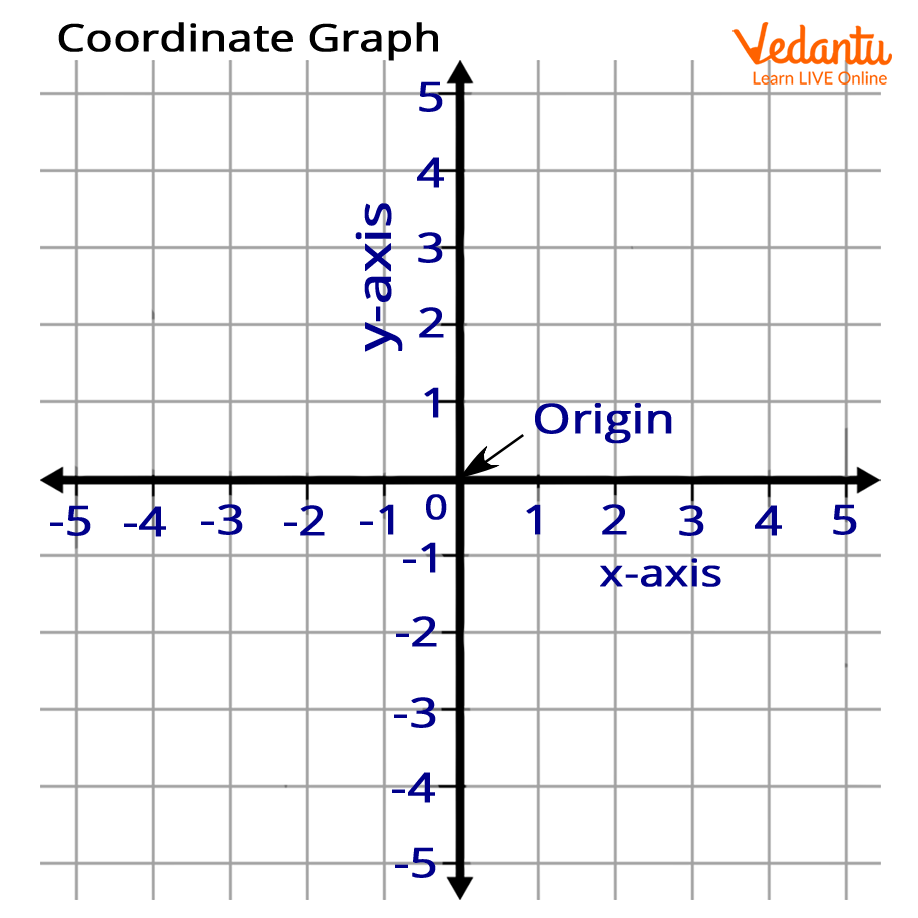
Axis - There are two axes in a coordinate plane. The horizontal line is called the x-axis and the vertical line is called the y-axis.
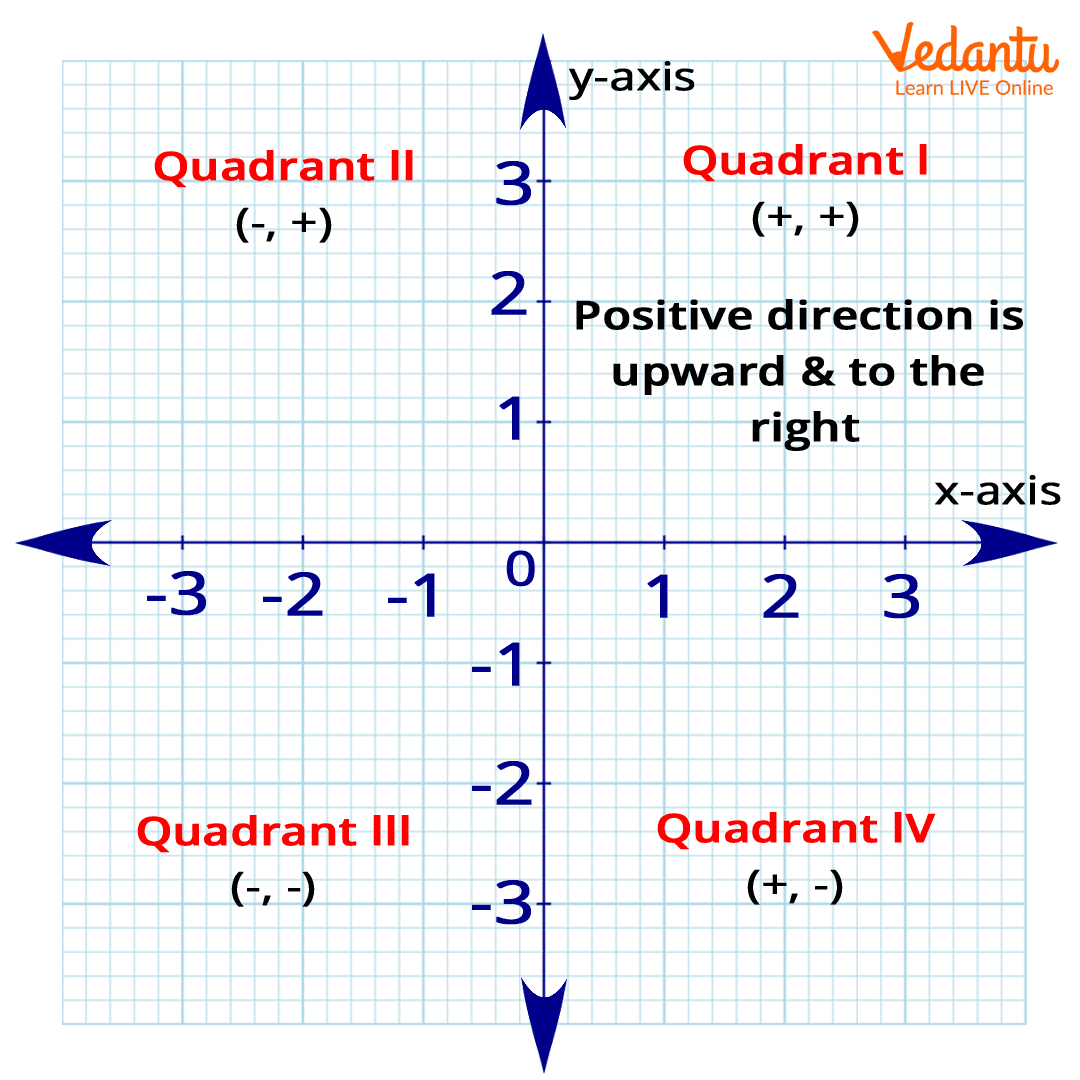
Quadrant - The four equal divisions by origin are known as the quadrants. They are known as Quadrant I, Quadrant II, Quadrant III, and Quadrant IV.
Quadrant I - This quadrant comes in the positive - positive part, i.e., the x-axis is positive and the y-axis is also positive.
Quadrant II - This quadrant comes in the negative - positive part, i.e., the x-axis is negative and the y-axis is positive.
Quadrant III - The third quadrant comes in the negative - negative part, i.e., both the x-axis and y-axis are negative.
Quadrant IV - The fourth quadrant comes in the positive - negative quadrant, i.e., the x-axis is positive and the y-axis is negative.
Positive x-axis - The horizontal line towards the right from the origin is the positive x-axis.
Negative x-axis - The horizontal line towards the left from the origin is the negative x-axis.
Positive x-axis - The vertical line above the origin is the positive y-axis.
Negative x-axis - The vertical line below the origin is the negative y-axis.
Coordinates - The points that are located on the x and y axes or the coordinate graph are called the coordinates. It is always written in a particular format, which is (x,y).
Here is an image to understand the coordinate graph in a better way:
How to Locate a Point on the Coordinate Plane?
Here is the step by step explanation of locating a point on the coordinate plane:
Read the point carefully.
Find the quadrant by checking the sign of the coordinates. For example - (2,3) will be on the quadrant I, (-4,5) will be on quadrant II, (-3,-2) will be on the quadrant III, and (6,-3) will be on the quadrant IV.
Once you have found the coordinate, locate the point on the x-axis on the right quadrant. For example - Point A on the first quadrant has coordinate 3 on the x-axis.
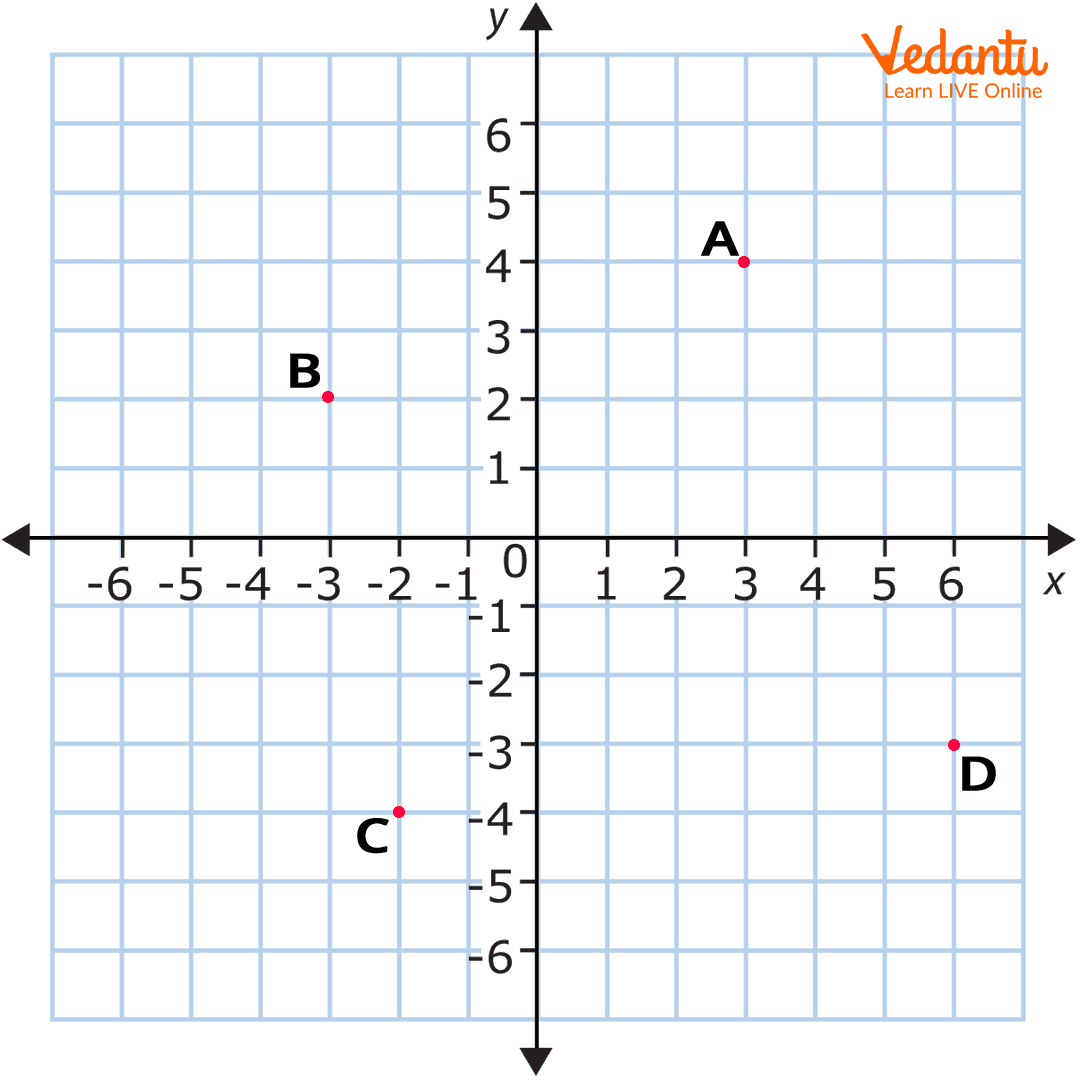
Similarly, locate the point on the y-axis on the right quadrant. For example - On the above image, point A on the first quadrant has coordinate 4 on the y-axis.
The point is located. For the above image, point A has the coordinate of (3,4).
How to Draw the Coordinate Graph?
Here is the step by step explanation of how to draw the graph:
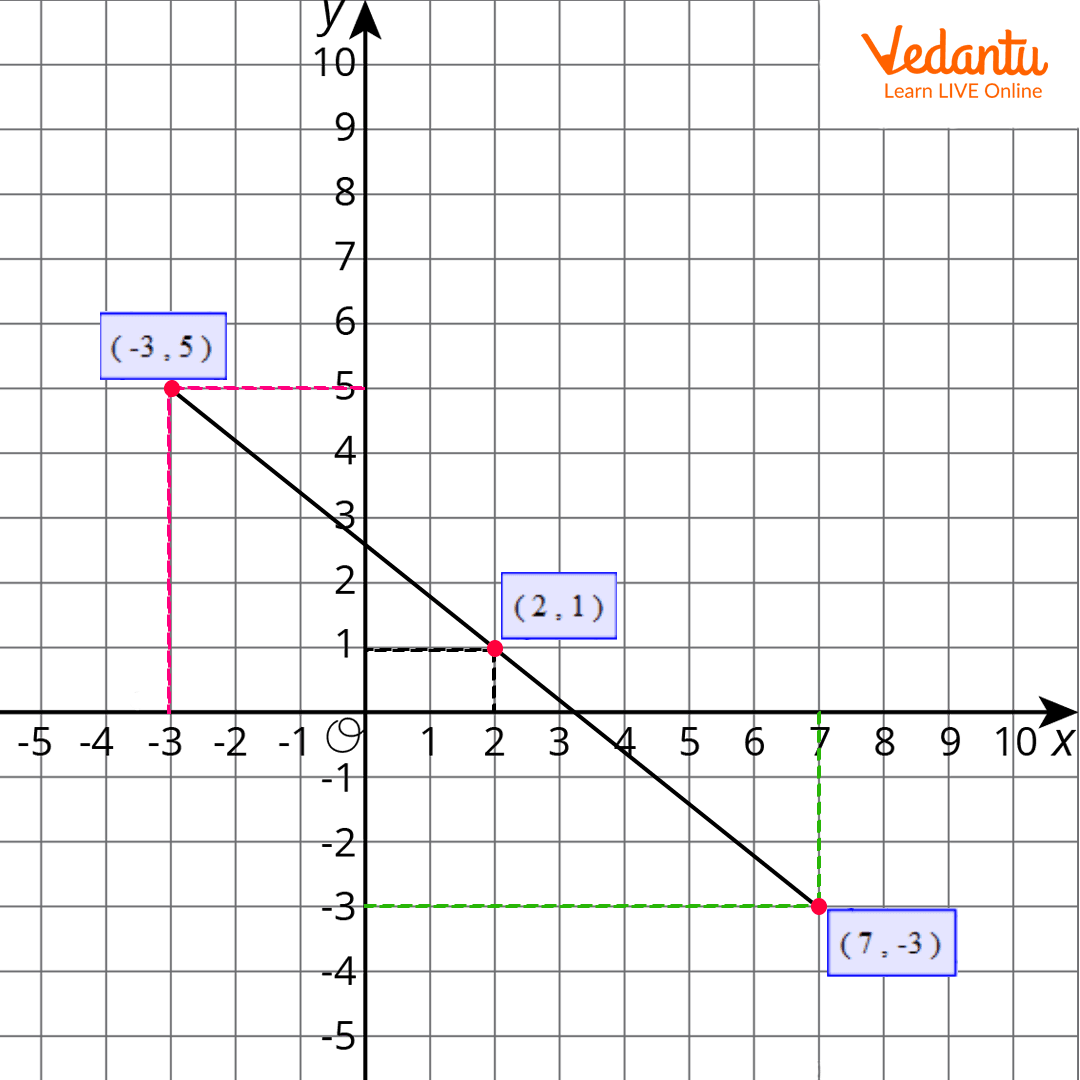
Let us consider the following points: (-3,5), (2,1), and (7,-3)
Identify the quadrants of the coordinates. For the first coordinates (-3,5), the quadrant will be quadrant II, for the second coordinates (2,1), the quadrant will be quadrant I, and for the third coordinates (7,-3), the quadrant will be quadrant IV.
Find the points on the right quadrant on the x-axis and y-axis.
Join the points to form a straight line.
Consider the following image for your reference:
Quick Fact
The coordinate plane was introduced by French mathematician René Descartes. It is after his name that coordinate plane is also called Cartesian coordinate system. |
Conclusion
So far you have learned about the coordinate graph, about its components, how to locate a point on the coordinate graph, and how to draw the graph. If you want to know more details about the coordinate graphs and solve exercises, you can explore more on our website. Apart from the coordinate graphs, we have covered all other mathematical topics. So you can explore them anytime on our website and enjoy learning!
FAQs on Understanding the Coordinate Grid in the Cartesian Plane
1. What is a coordinate grid in math?
A coordinate grid is a system of perpendicular number lines used to locate points in a plane using ordered pairs. It consists of:
- A horizontal line called the x-axis
- A vertical line called the y-axis
- Their intersection point called the origin (0,0)
2. How do you plot a point on a coordinate grid?
To plot a point on a coordinate grid, move horizontally to the x-value first, then vertically to the y-value. Follow these steps:
- Start at the origin (0,0)
- Move right (positive) or left (negative) along the x-axis
- Move up (positive) or down (negative) along the y-axis
3. What is the origin on a coordinate grid?
The origin is the point where the x-axis and y-axis intersect, and its coordinates are (0,0). It serves as the reference point for locating all other points on the coordinate plane. From the origin, movements left/right change x-values and movements up/down change y-values.
4. What are the four quadrants in a coordinate grid?
The four quadrants are the four sections of the coordinate grid divided by the x-axis and y-axis. The signs of coordinates in each quadrant are:
- Quadrant I: (+, +)
- Quadrant II: (−, +)
- Quadrant III: (−, −)
- Quadrant IV: (+, −)
5. How do you find the distance between two points on a coordinate grid?
The distance between two points is found using the distance formula: d = √[(x₂ − x₁)² + (y₂ − y₁)²]. Steps:
- Subtract the x-coordinates
- Subtract the y-coordinates
- Square both results and add them
- Take the square root
6. What is the midpoint formula on a coordinate grid?
The midpoint formula finds the point halfway between two coordinates: ((x₁ + x₂)/2, (y₁ + y₂)/2). To calculate:
- Add the x-coordinates and divide by 2
- Add the y-coordinates and divide by 2
7. What is the difference between the x-axis and y-axis?
The x-axis is the horizontal number line, while the y-axis is the vertical number line on a coordinate grid. Key differences:
- x-axis measures horizontal movement
- y-axis measures vertical movement
- Points on the x-axis have y = 0
- Points on the y-axis have x = 0
8. How do you graph a linear equation on a coordinate grid?
To graph a linear equation, plot at least two points that satisfy the equation and draw a straight line through them. For example, for y = 2x + 1:
- If x = 0, then y = 1 → point (0,1)
- If x = 1, then y = 3 → point (1,3)
9. How do you reflect a point across the x-axis or y-axis?
Reflecting a point changes the sign of one coordinate depending on the axis. Rules:
- Across the x-axis: (x, y) → (x, −y)
- Across the y-axis: (x, y) → (−x, y)
10. What are common mistakes when using a coordinate grid?
Common mistakes on a coordinate grid include reversing coordinates and moving in the wrong direction. Students often:
- Swap x and y values (writing (y, x) instead of (x, y))
- Move vertically before horizontally
- Ignore negative signs
- Plot points in the wrong quadrant